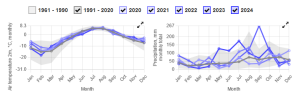
 Station display pages have now been equipped with climateThe average weather we would expect over a long period of time (seasons, years, decades). Climate varies from place-to-place across the Earth. Climate is determined by long-term (over at least... More graphics depicting temperature and precipitation data. Monthly numbers are shown for the past two ‘WMO climateThe average weather we would expect over a long period of time (seasons, years, decades). Climate varies from place-to-place across the Earth. Climate is determined by long-term (over at least... More normals’ (1961-1990 and 1991-2020) and individual years (2020-2024).
ClimateThe average weather we would expect over a long period of time (seasons, years, decades). Climate varies from place-to-place across the Earth. Climate is determined by long-term (over at least... More data for the stations where extracted via Copernicus ClimateThe average weather we would expect over a long period of time (seasons, years, decades). Climate varies from place-to-place across the Earth. Climate is determined by long-term (over at least... More Data Store, from the global gridded reanalysis product: ERA5 monthly averaged data on single levels from 1961 to present. Users can select specific ‘WMO climateThe average weather we would expect over a long period of time (seasons, years, decades). Climate varies from place-to-place across the Earth. Climate is determined by long-term (over at least... More normals’ and individual years, allowing comparison of recent years’ climateThe average weather we would expect over a long period of time (seasons, years, decades). Climate varies from place-to-place across the Earth. Climate is determined by long-term (over at least... More data with historic climateThe average weather we would expect over a long period of time (seasons, years, decades). Climate varies from place-to-place across the Earth. Climate is determined by long-term (over at least... More normal.